Post-2020 fund performance in focus
Analysing the performance of the most recent fund vintages is particularly important in today’s market environment, where capital has been deployed under different macroeconomic conditions. The INREV IRR Index provides a robust foundation for this analysis, offering one of the most comprehensive datasets on European closed end real estate fund performance and an expanding coverage of more recent vintage vehicles.
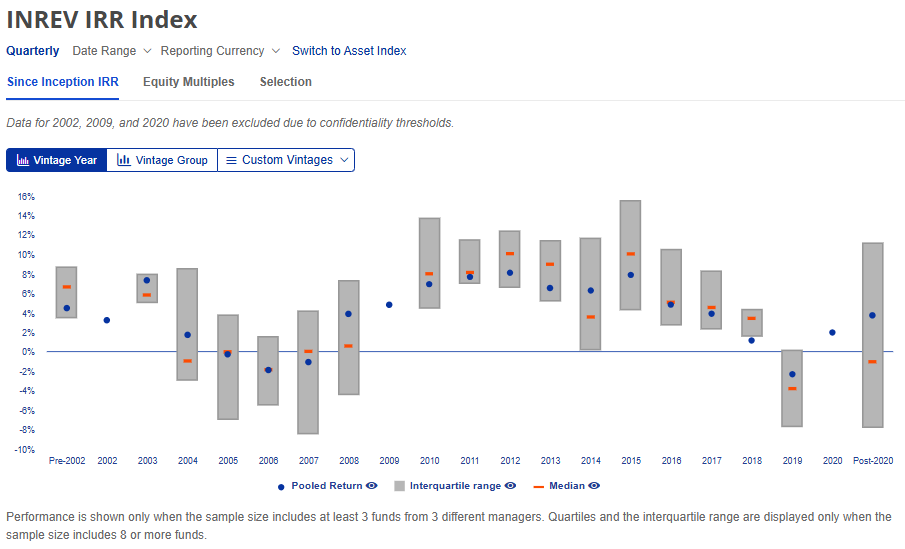
As of Q4 2025, the INREV IRR Quarterly Index release comprises 305 funds spanning vintages from pre-2003 to post-2020, offering coverage across multiple market cycles, with a combined paid in capital of €108.3 billion.
Building on this expanded coverage, the INREV IRR Analysis Tool enables users to construct bespoke vintage groupings and conduct tailored performance analysis. This provides deeper insights into return dispersion, capital deployment timing and the evolving dynamics of the most recent fund vintages and cohorts. The Tool also allows for more granular (peer) comparisons for funds in their initial years, helping users to understand the J-curve impact.
Most recent fund vintages display the largest return dispersion in Q4 2025
As of Q4 2025, the post-2020 vintage group recorded a positive since inception IRR after fees. The 20 vehicles launched after 2020 delivered a pooled IRR of 3.72%, turning positive from -0.36% in Q4 2024. They also showed the widest dispersion of returns among all vintages, with upper and lower quartiles standing at 11.10% and -7.86%, respectively. The large dispersion in returns across the most recent vintages highlights that fund selection is particularly important within a given vintage group, although investment timing remains a key driver of performance.
A closer look at the post-2020 vintages: 2021, 2022 and 2023-2024
The INREV IRR Analysis Tool enables a more granular analysis of the post-2020 vintage cohort, supporting a clearer understanding of the performance dynamics of the most recently launched funds. As of Q4 2025, performance for the 2021 and 2022 vintages and the combined 2023-2024 vintage group can be analysed separately.
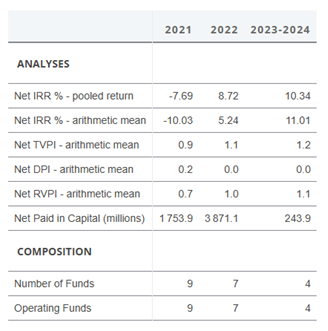
With a pooled IRR of -8.12%, the nine vehicles launched in 2021 recorded the weakest performance among the most recent vintages as of Q4 2025. Their dispersion, with both upper and lower quartiles in negative territory (-0.61% and -13.08%, respectively), reflects how funds launched at the peak of the current cycle were particularly exposed to subsequent macroeconomic shifts, most notably the sharp increase in interest rates that occurred in 2022 and 2023. This negatively affected portfolio valuations and placed additional pressure on leverage structures of the eight value added vehicles included in the 2021 sample (the ninth vehicle in the sample is core). The impact on IRR performance was amplified by the fact that these adjustments occurred during the early stage of their life cycle.
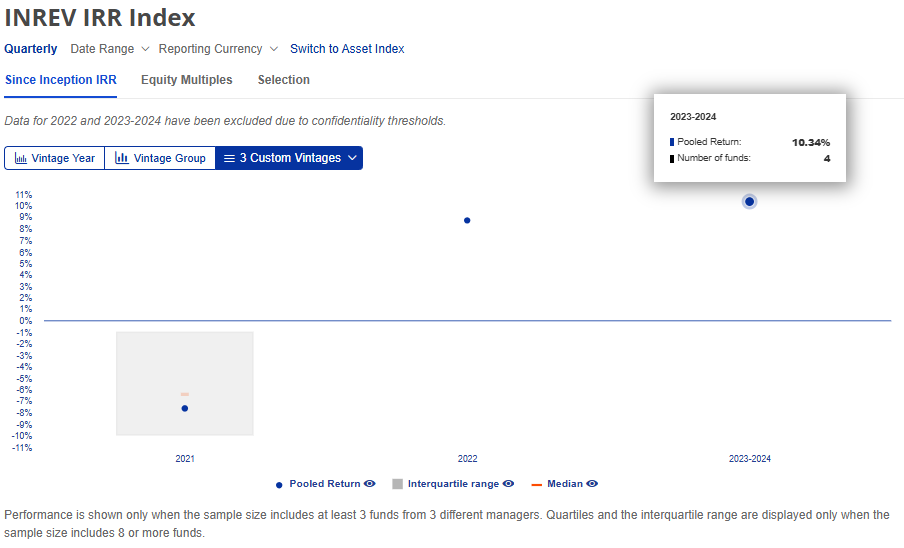
On the contrary, the seven funds launched in 2022 and the four launched in 2023 and 2024 displayed positive performance as of Q4 2025, with pooled IRRs of 8.72% and 10.34%, respectively.
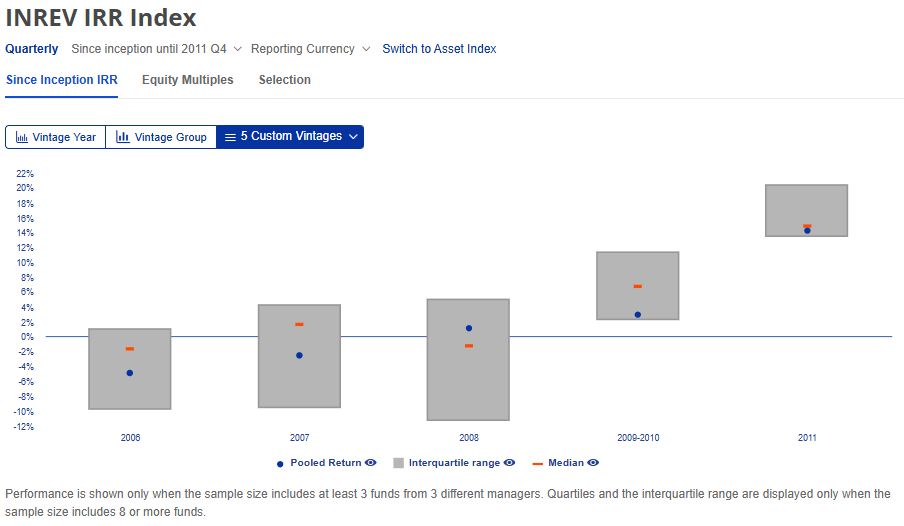
This pattern is similar to what occurred during and after the GFC. Using the date range functionality, users can view performance as of Q4 2011 for the 2006–2011 vintage funds. The results clearly show how similar macroeconomic conditions and more advantageous valuations enabled post-crisis funds to achieve strong returns at that point in time.
The IRR Analysis Tool provides additional insights into GPs’ capital deployment strategies. Notably, the average paid-in capital per vehicle as of Q4 2025 for the 2022 vintage funds is almost three times higher (2.8x) than that of the 2021 vintage funds (€553.0 million versus €194.9 million per vehicle, respectively). This suggests that managers of the 2021 vintage funds may have adopted a more cautious deployment approach, potentially waiting for improved market conditions, whereas the 2022 vintage appears to have deployed capital more actively, benefiting from more favorable entry pricing.
The INREV IRR Analysis Tool is available to INREV members and allows them to monitor these dynamics on a quarterly basis. You can also gain more insights from the latest IRR Index report for Q4 2025.