GREFI at 20 years: a global view of non-listed Real Estate
The Global Real Estate Fund Index (GREFI) has reached an important milestone, now covering more than 20 years of data. Launched in 2014 by INREV, ANREV and NCREIF, the Index began with a sample of 119 funds, with its first data point in Q1 2005. Since then, GREFI has grown significantly and, as of Q4 2025, includes 440 funds with a total gross asset value (GAV) of USD 941.9 billion.
Over time, GREFI has become a key reference point for the industry, improving transparency and offering a clear, global view of non-listed real estate performance. It allows market participants to assess trends across regions as well as at an aggregate, global level.
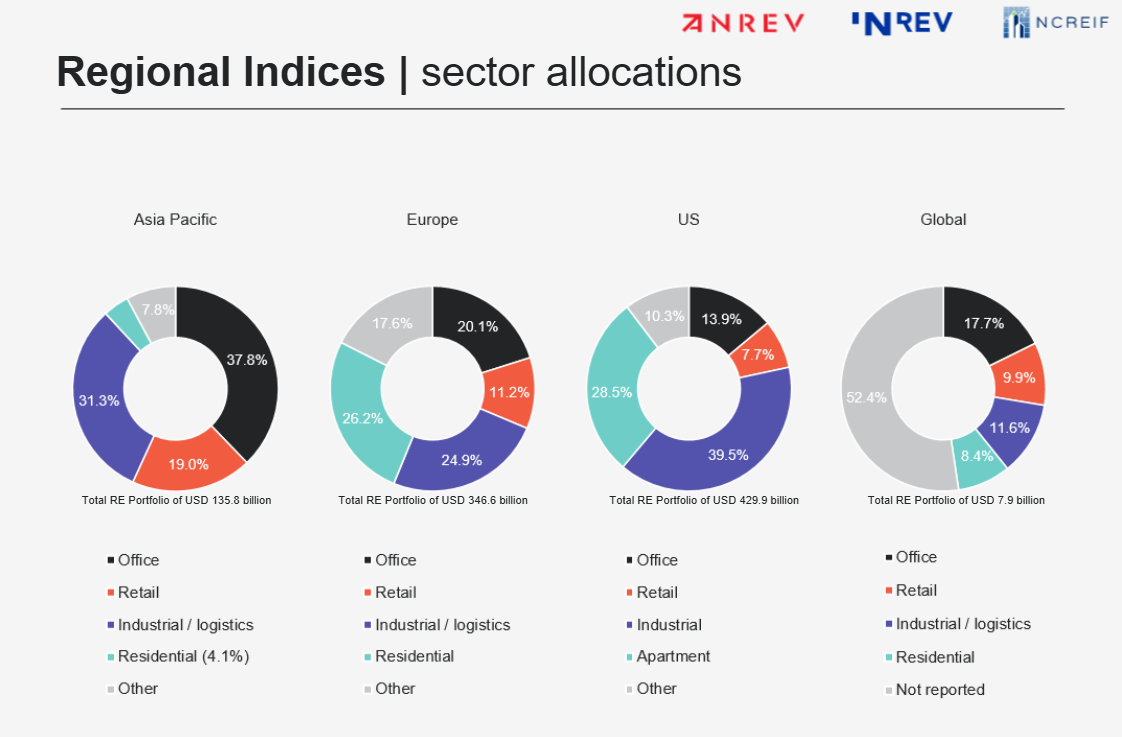
As of Q4 2025, US funds account for 45.7% of total GAV, followed by European funds at 38.5%, Asia Pacific funds at 15.0% (with a strong concentration in Australia), and global strategy funds at 0.9%. In terms of sector allocation, portfolios are primarily concentrated in the four main sectors: industrial/logistics (33%), residential (24%), office (20%), and retail (11%).
European funds’ risk and performance in a global context
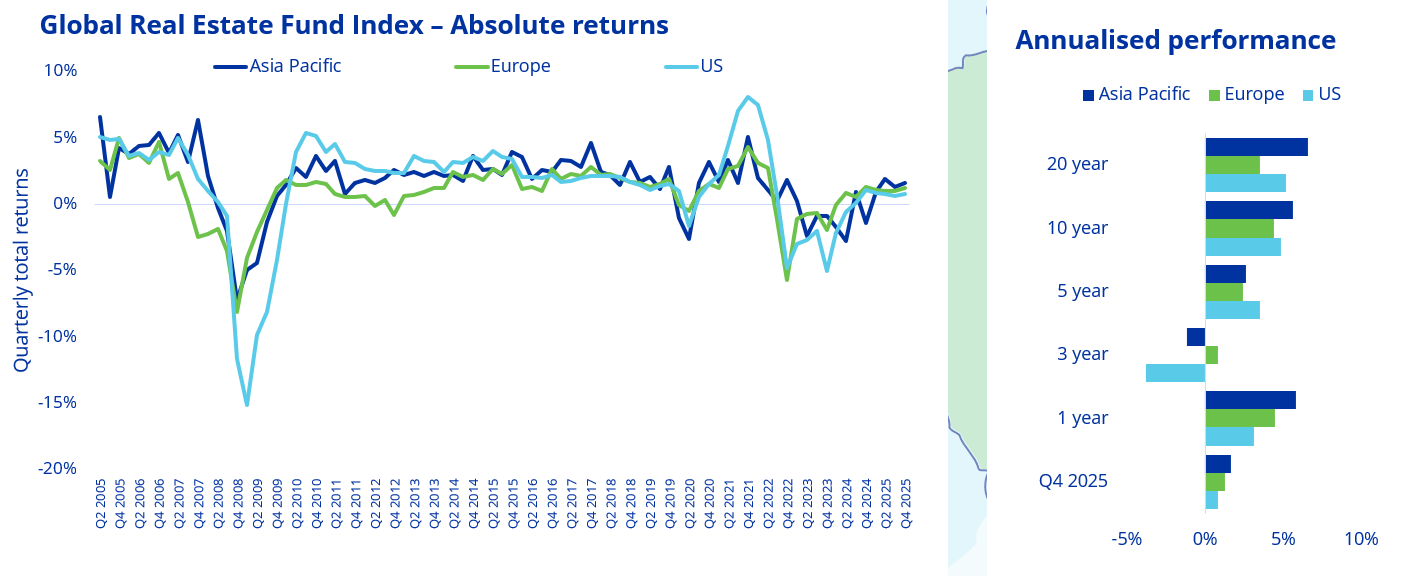
Performance across the three regions remained positive and stable throughout 2025. In Q4 2025, GREFI recorded a total return of 1.08%, marking the strongest quarterly result since Q2 2022.
Within this context, European funds delivered their best quarterly performance of the year, with total returns of 1.24% in Q4 2025. This also marks the ninth consecutive quarter in which European funds have outperformed US funds. As a result, European funds outperform US funds over the short term, with one- and three-year rolling returns of 4.43% and 0.82%, compared with 3.10% and -3.78% for US funds.
However, US funds outperform Europe over the medium term, with five-year rolling returns of 3.49% and 2.44% respectively, and also over the longer term, with 20-year rolling returns of 5.17% for the US and 3.47% for Europe. Asia Pacific outperforms the other two regions over different time horizons, such as the one year rolling return (5.82%).
Despite Europe displaying lower annualised returns over the medium to long term, it shows lower return dispersion compared to the other two regions. The standard deviation of 20 year annualised returns stands at 6.8% for Europe, considerably lower than the US and Asia Pacific at 12.7% and 8.2% respectively. This lower volatility indicates a more stable and consistent performance profile for European funds.
Source: GREFI 2025 Q4
Looking at portfolio composition, funds investing in Europe show a different sector profile compared to the US. Europe has a lower allocation to industrial/logistics (25% versus 40%), a higher exposure to office (20% versus 14%), and a similar allocation to residential (26% versus 29%). European funds also allocate more to retail (11% versus 8%) and to other sectors, reflecting a broader diversification beyond the main property types.
Source: GREFI 2025 Q4
Real returns confirm the trend: Europe strong short and medium term, US leading long term
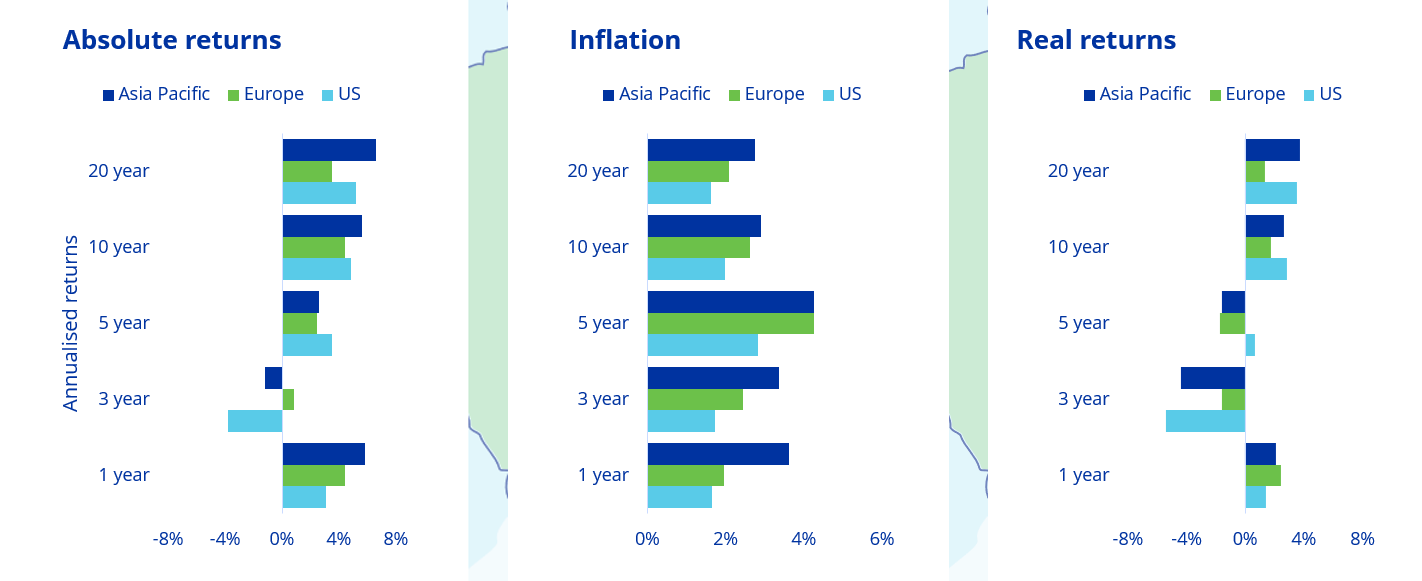
Adjusting returns for inflation¹ provides an additional comparison across regions, removing the impact of differing inflation environments and offering a clearer view of underlying real performance.
On this basis, European funds maintain a solid position in the short and medium term, outperforming other regions on both one- and three-year rolling returns, at 2.42% and -1.58% respectively.
However, European funds were more affected by the sharp rise in inflation and interest rates in 2022, which continues to weigh negatively on their longer term performance. Over five and ten years, real returns stand at -1.75% and 1.74%, making them the weakest among the regions on a long term basis. In contrast, US funds lead over longer horizons, with real returns of 0.66% over five years and 2.81% over ten years annualised returns.
Looking ahead, while recent trends point to stabilisation, investors should remain cautious, as the outlook for 2026 for the non listed real estate market will also depend on how inflation and interest rate dynamics continue to evolve.
Source: GREFI 2025 Q4, European Central Bank, U.S. Bureau of Labor Statistics, Australian Bureau of Statistics
Interested in more insights for GREFI performance? View the Q4 2025 results or check out our Data theme page.