Global ODCE Index performance shows improvement in 2025
Following the IQ blog on the annual performance of the European ODCE funds, we now look at insights from the Global ODCE Index’s latest annual results, unveiling the performance of open end diversified core funds globally. Here are some key highlights from the index’s annual and longer term results.
European ODCE funds’ performance falls behind Global ODCE performance in 2025
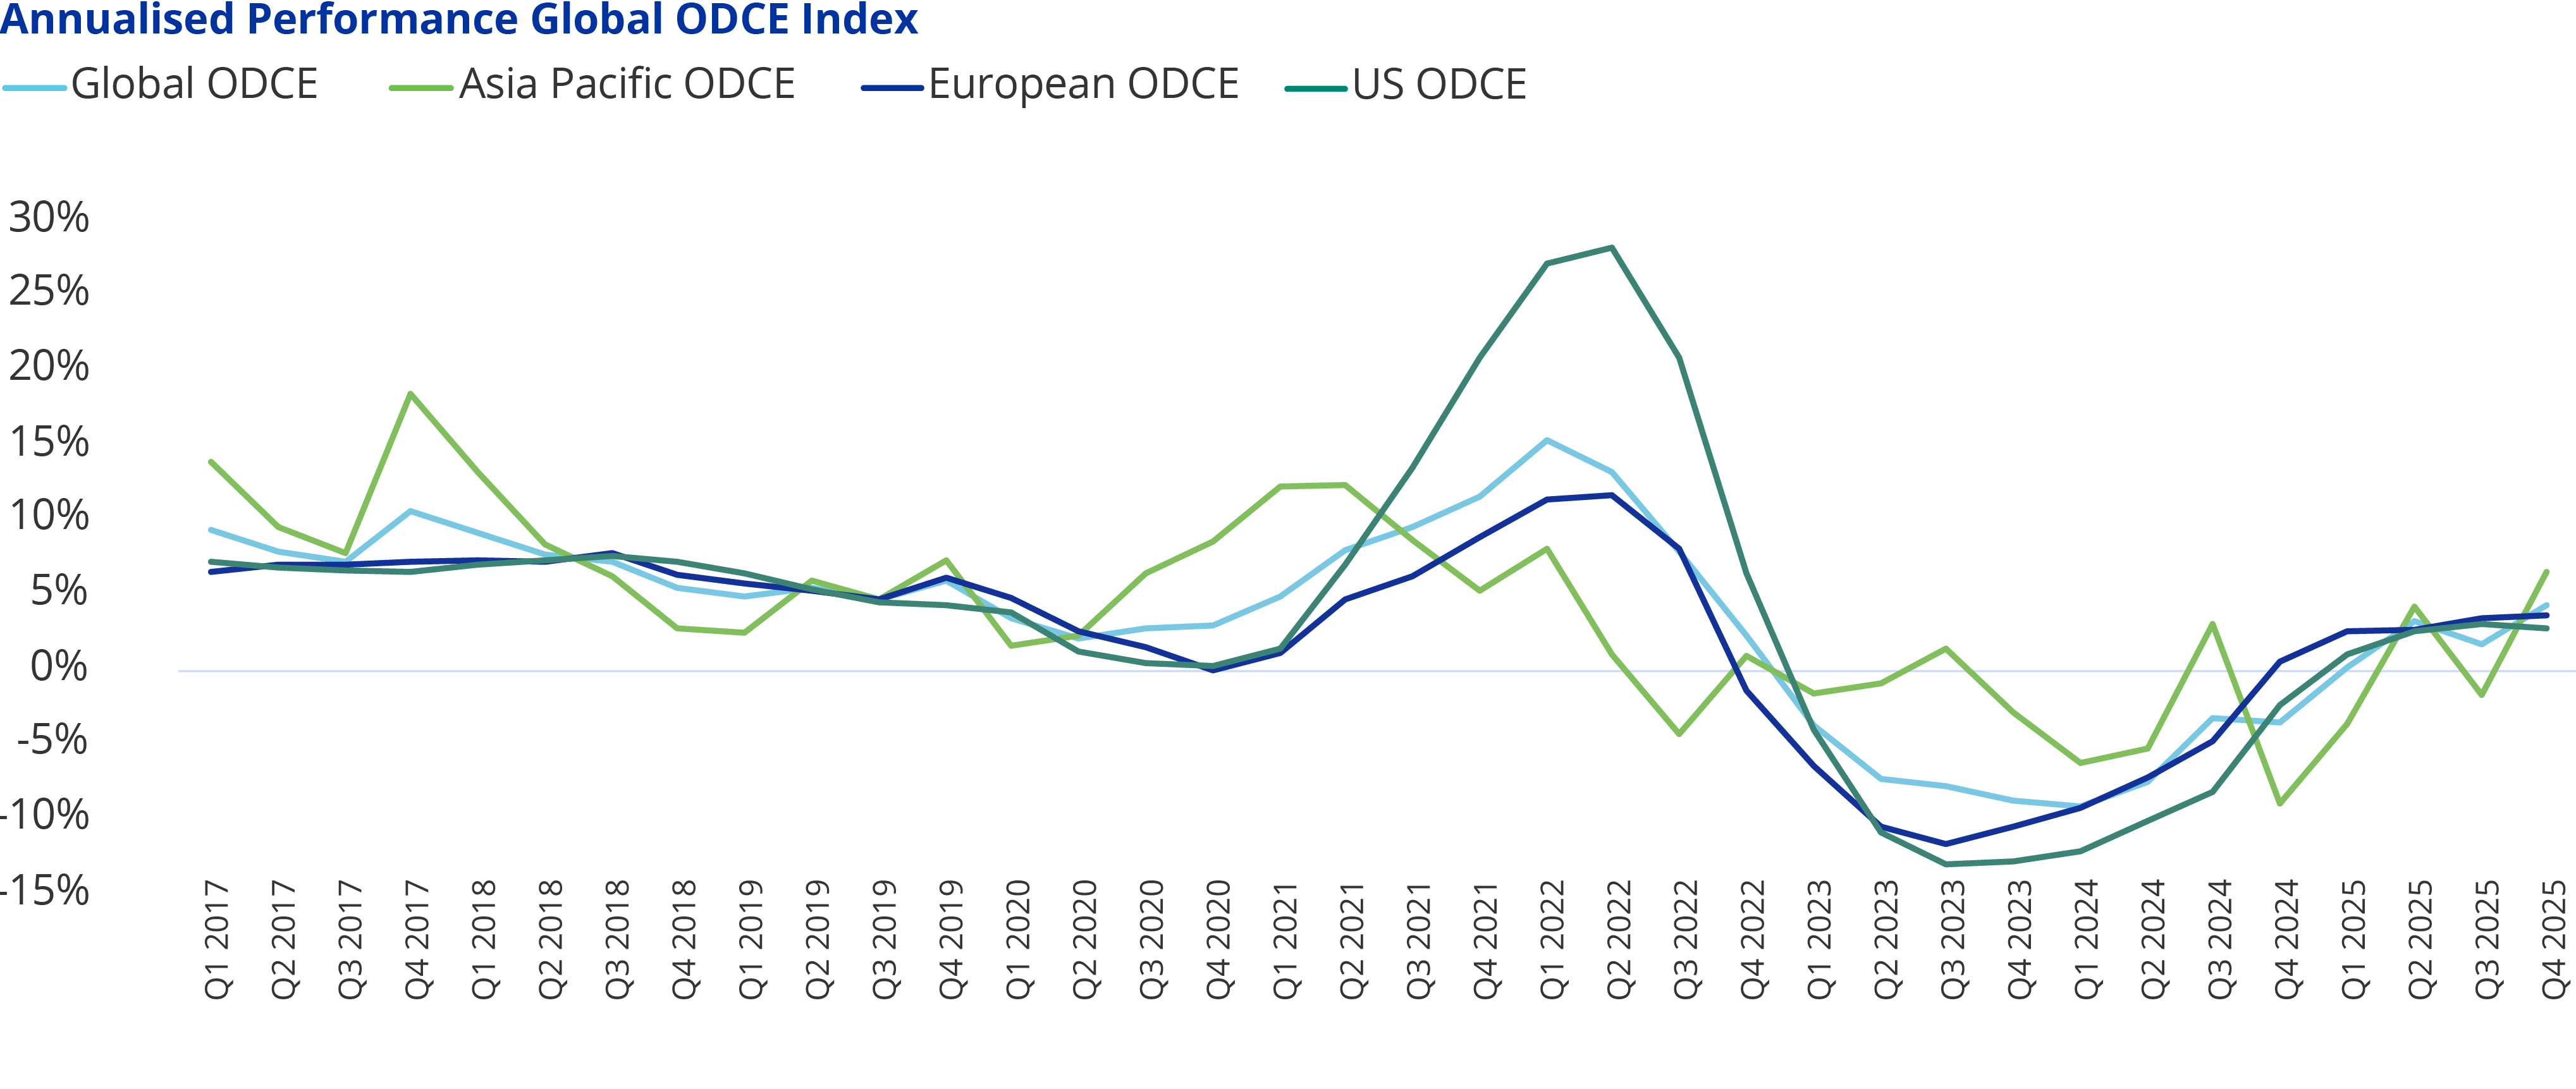
The Global ODCE Index measures the performance of 49 ODCE funds: 16 European funds, 8 Asia Pacific funds and 25 US funds, representing a combined GAV of $348.6 billion as of Q4 2025.
In 2025, the Global ODCE Index posted the highest one year rolling total return for the calendar year since 2021, at 4.45%. This is a 787 bps improvement over the equivalent figure of 2024. The performance is calculated on an equally weighted basis, with each region accounting equally in the global total return.
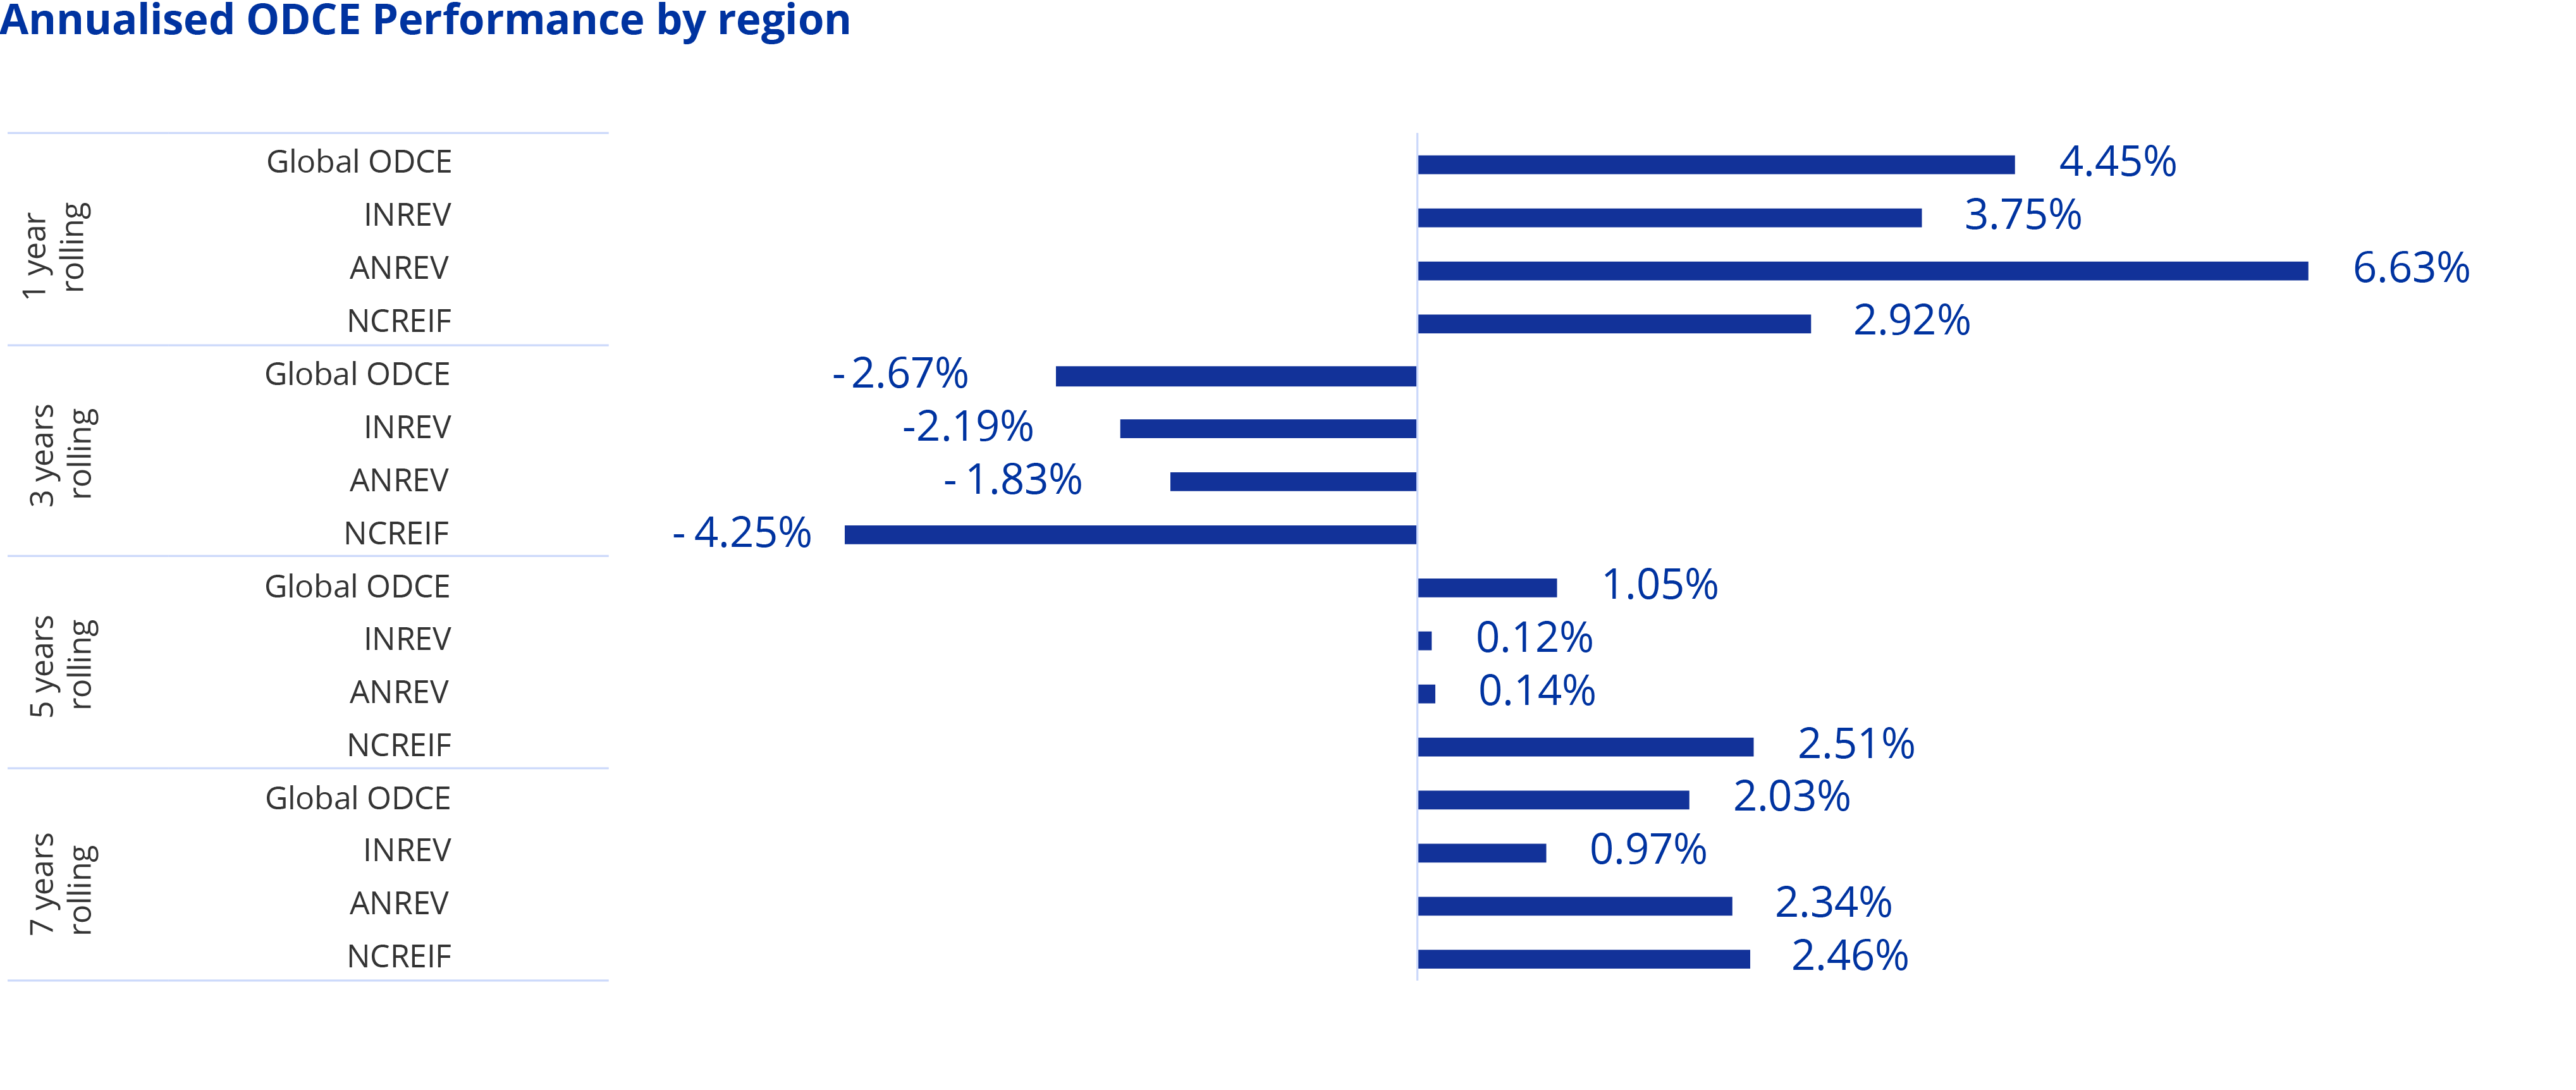
The annualised performance of the three regions reveals Asia Pacific ODCE funds’ outperformance in 2025, reporting a total return of 6.63%. The European ODCE funds fell behind the Global ODCE performance at 3.75%, followed by the US funds at 2.92%.
A similar pattern holds for the three year rolling returns, although European ODCE funds outperformed the Global ODCE Index by 48 bps, reporting an annualised return of -2.19%.
The longer term performances show the outperformance of the US ODCE funds, surpassing the Global ODCE Index performance by 146 bps and 43 bps on a five- and seven year rolling basis, respectively. European ODCE funds underperformed the Global ODCE Index on a five- and seven year rolling basis by 93 bps and 106 bps, respectively.
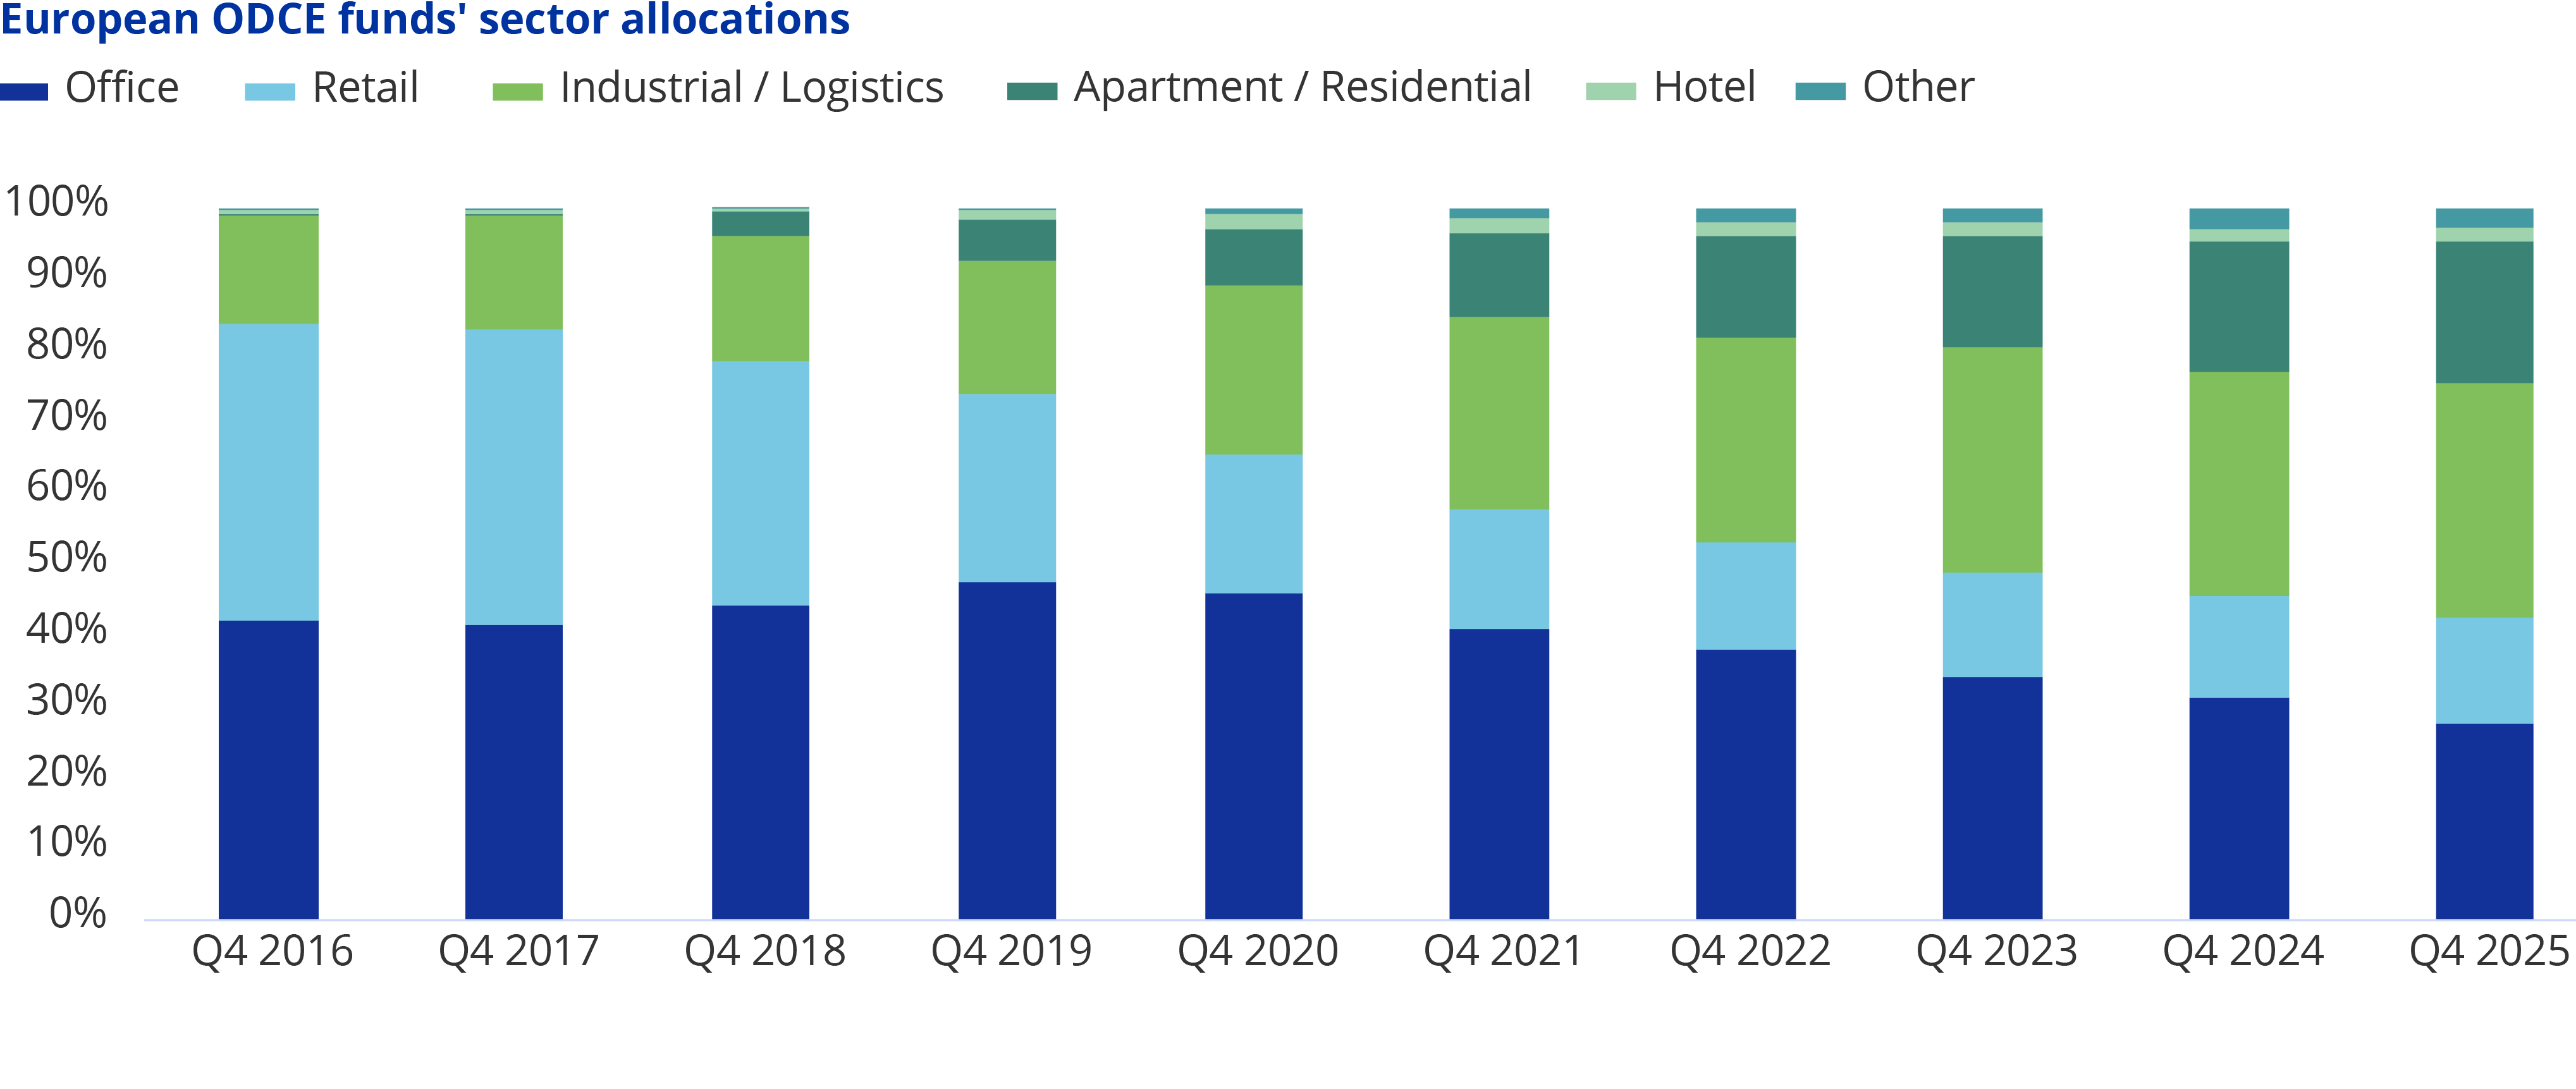
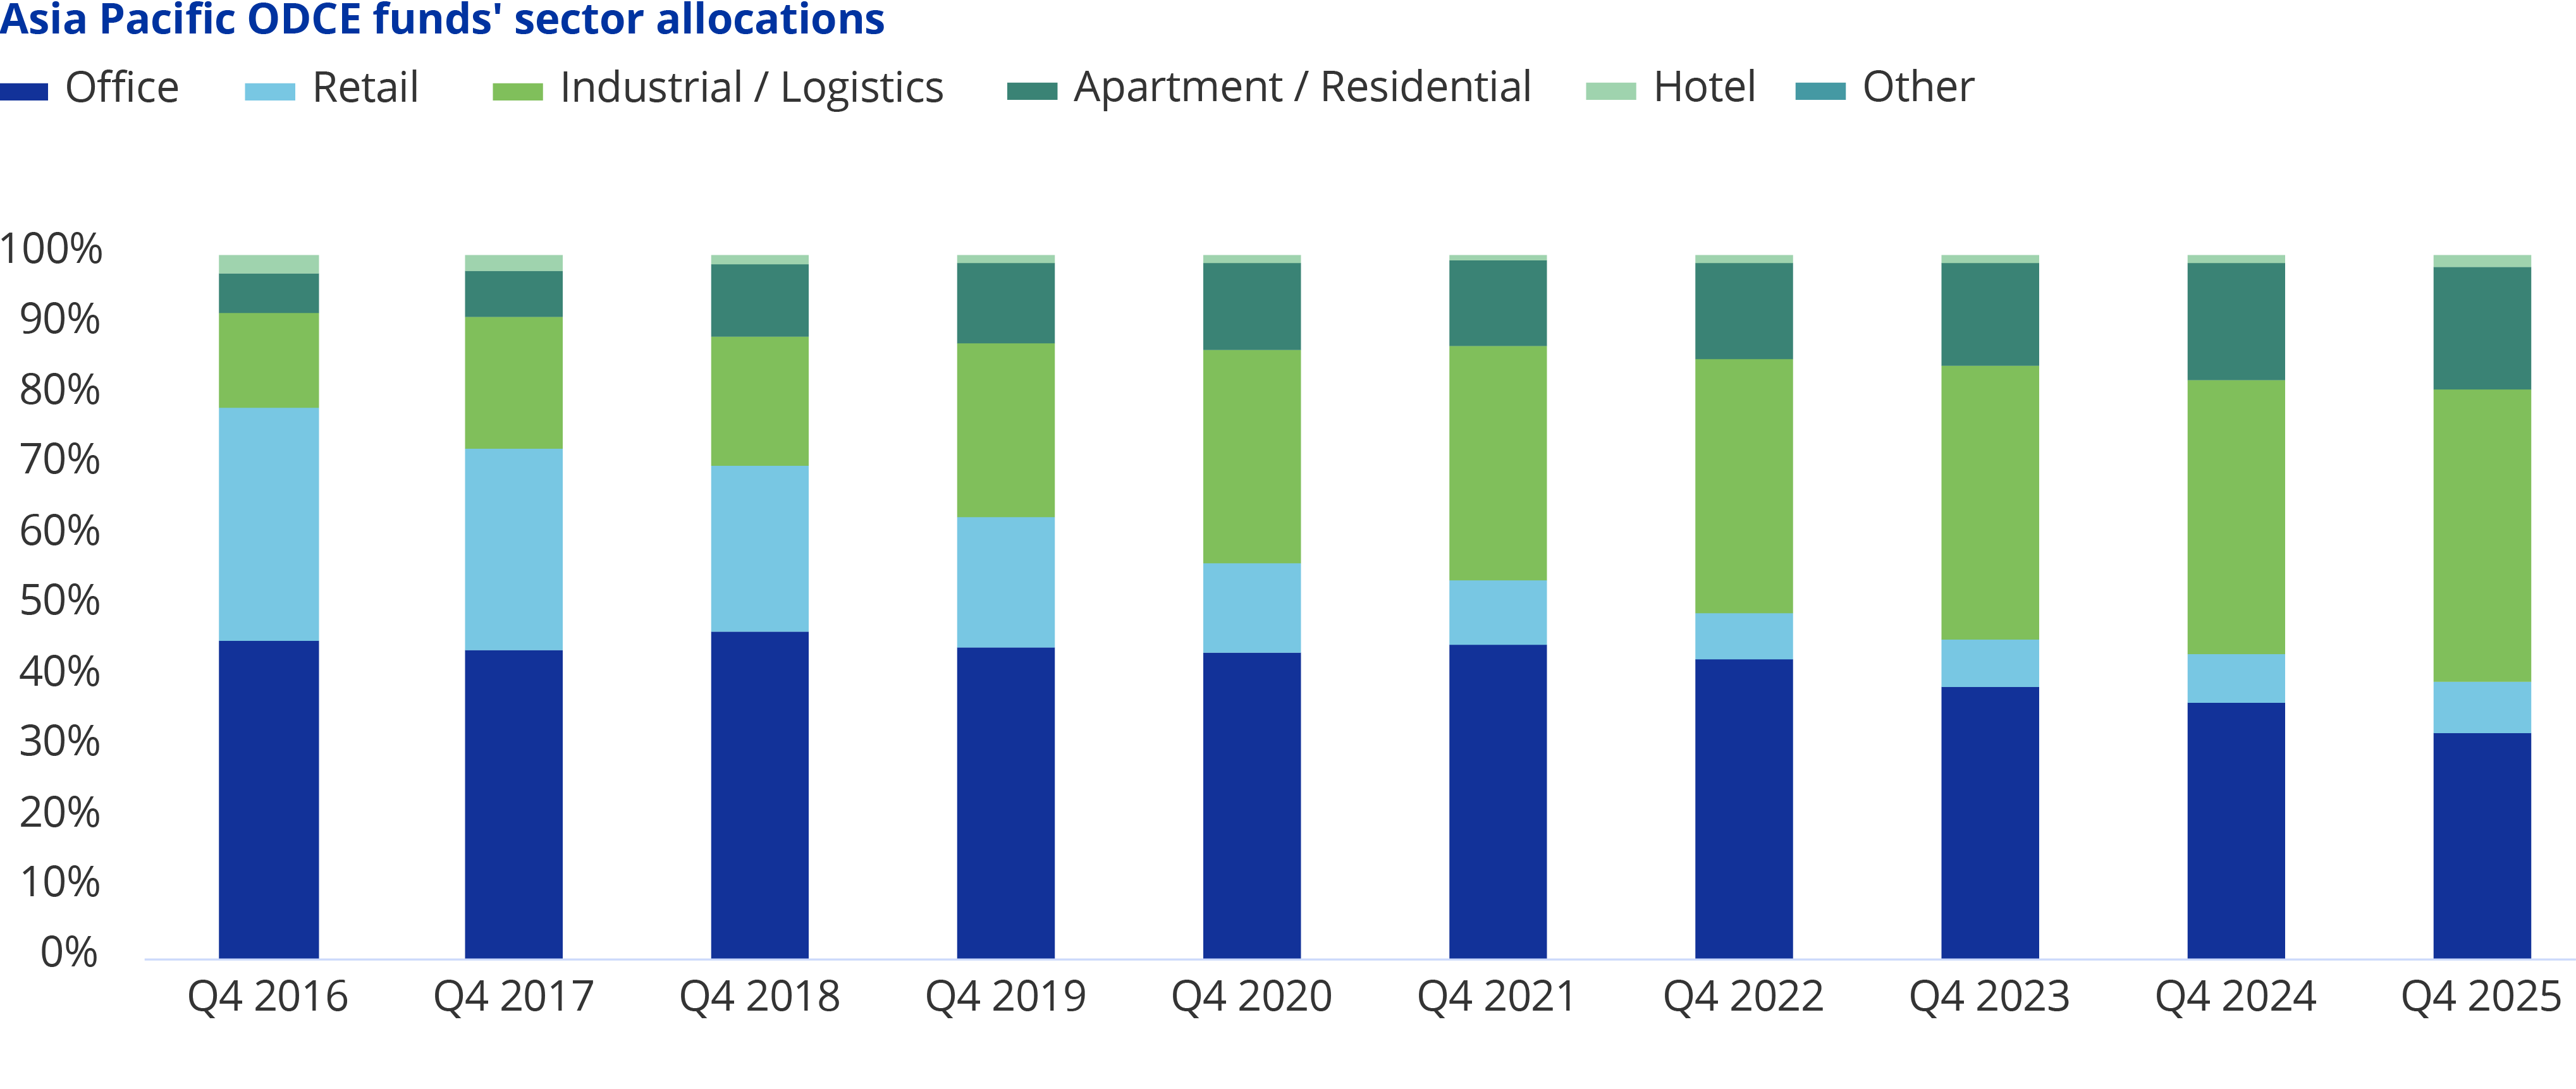
Industrial / logistics is the largest sector allocation across all three regions after gaining share in recent years at the cost of offices and retail
In 2016, European ODCE funds allocated their capital primarily towards offices and retail assets, which has shifted towards industrial / logistics at the cost of the former two sectors. Allocations towards residential real estate only became substantial in recent years, with the first reading above 10% in 2021. The sector now accounts for almost 20% by real estate portfolio value.
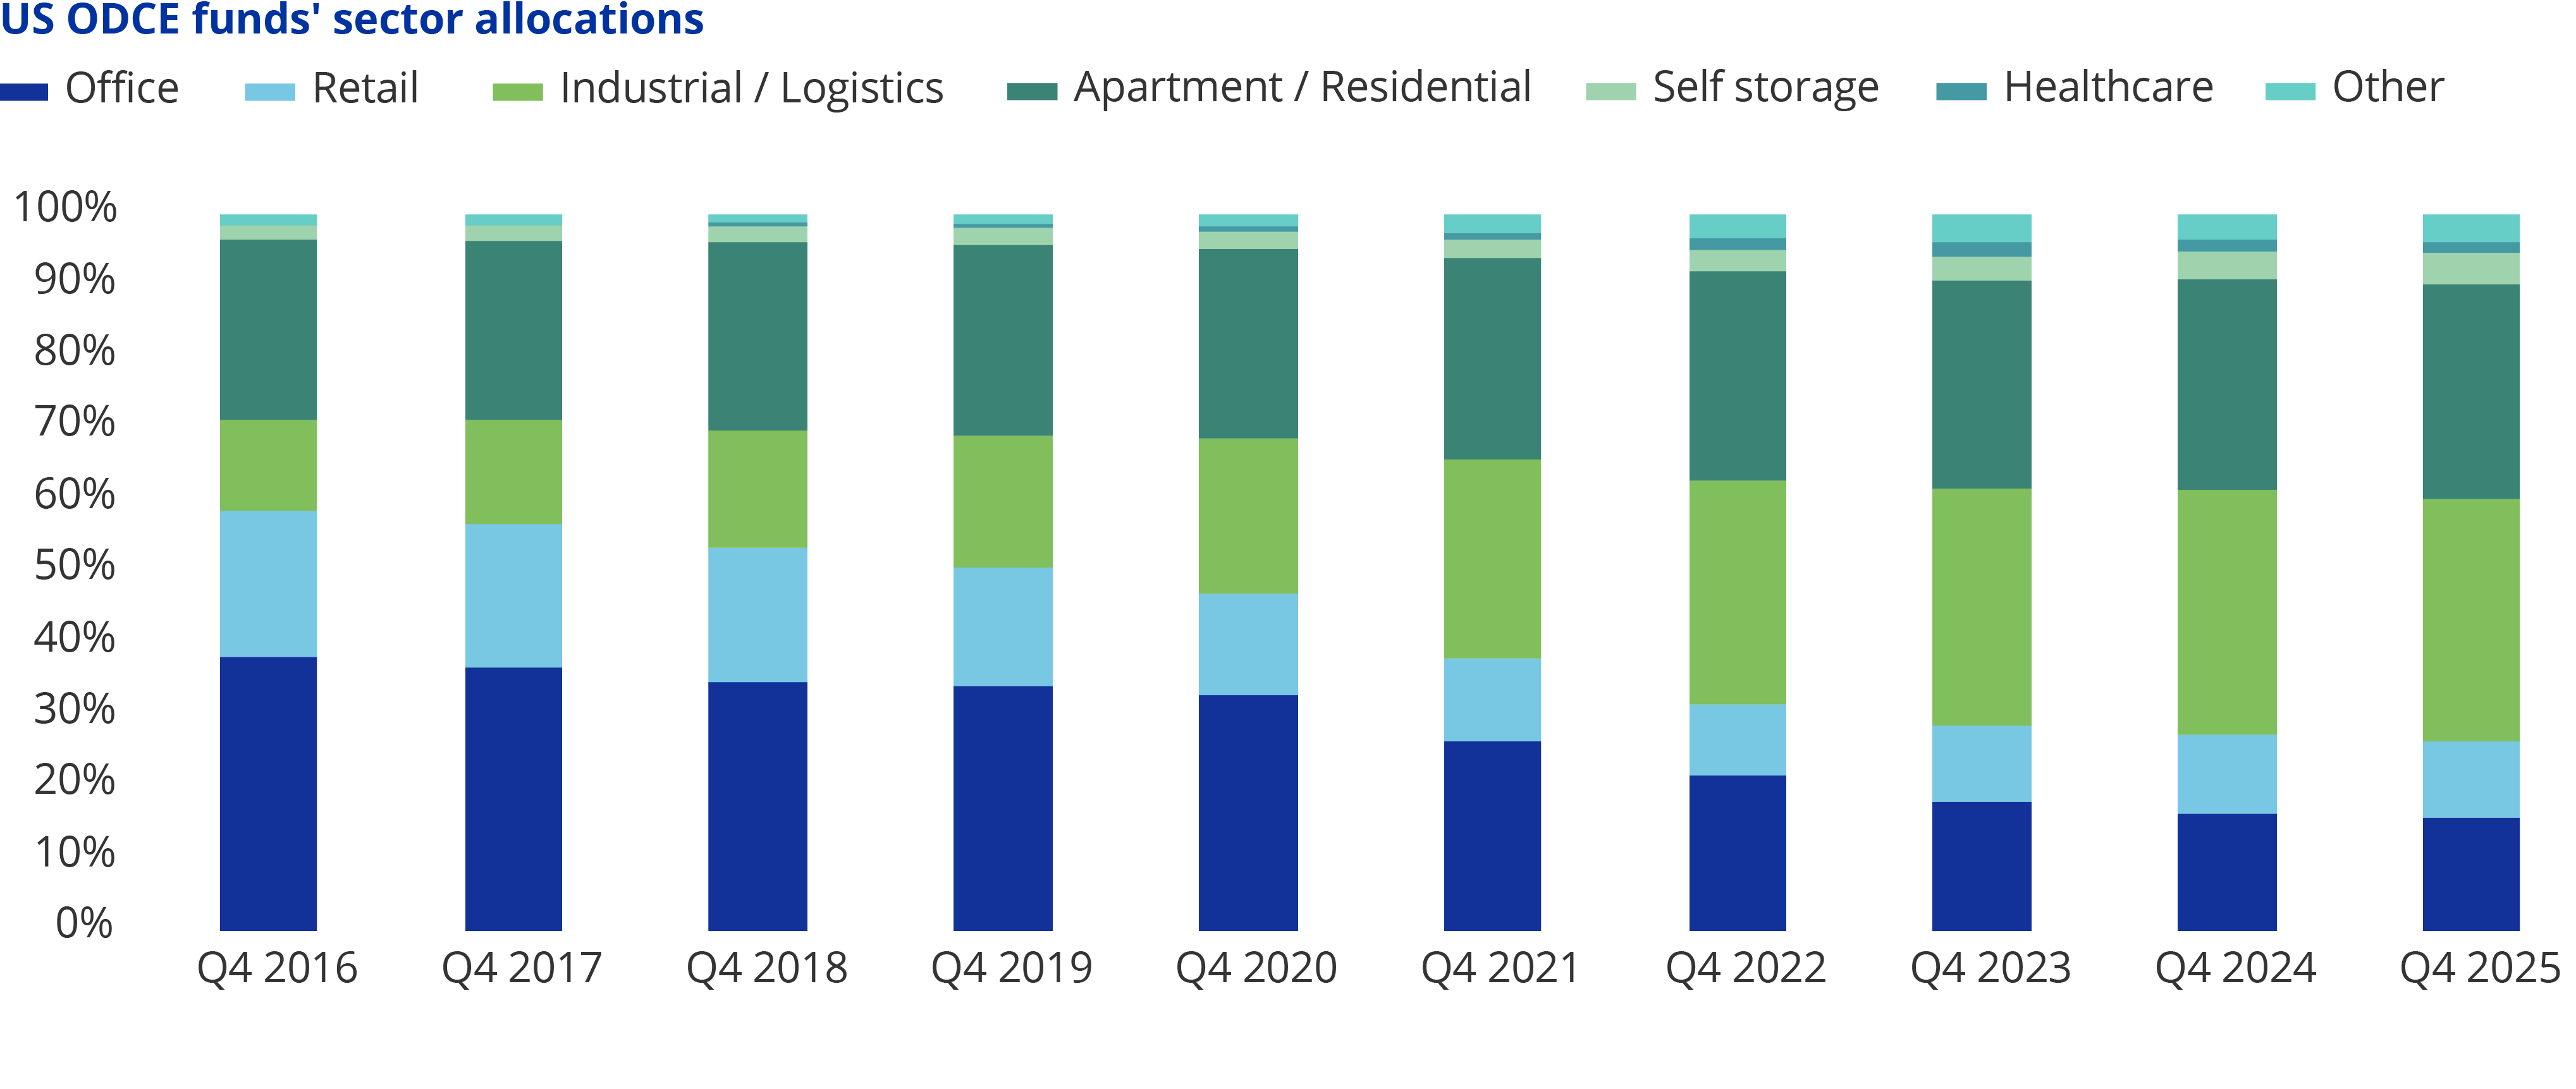
In contrast, the US ODCE funds have had a significant allocation towards residential assets since the beginning of the Global ODCE Index dataset, accounting for 25% of the index by portfolio value in 2016, which grew to almost 30% as of Q4 2025. A similar shift from offices and retail to industrial / logistics can be seen here as well, as the sector now represents the largest allocation at 34%.
The Asia Pacific ODCE funds have the largest allocation towards industrial / logistics across all three regions, at almost 42%. As a result, retail allocations are now the smallest across the three regions at 7%, this figure stood at 33% in 2016.
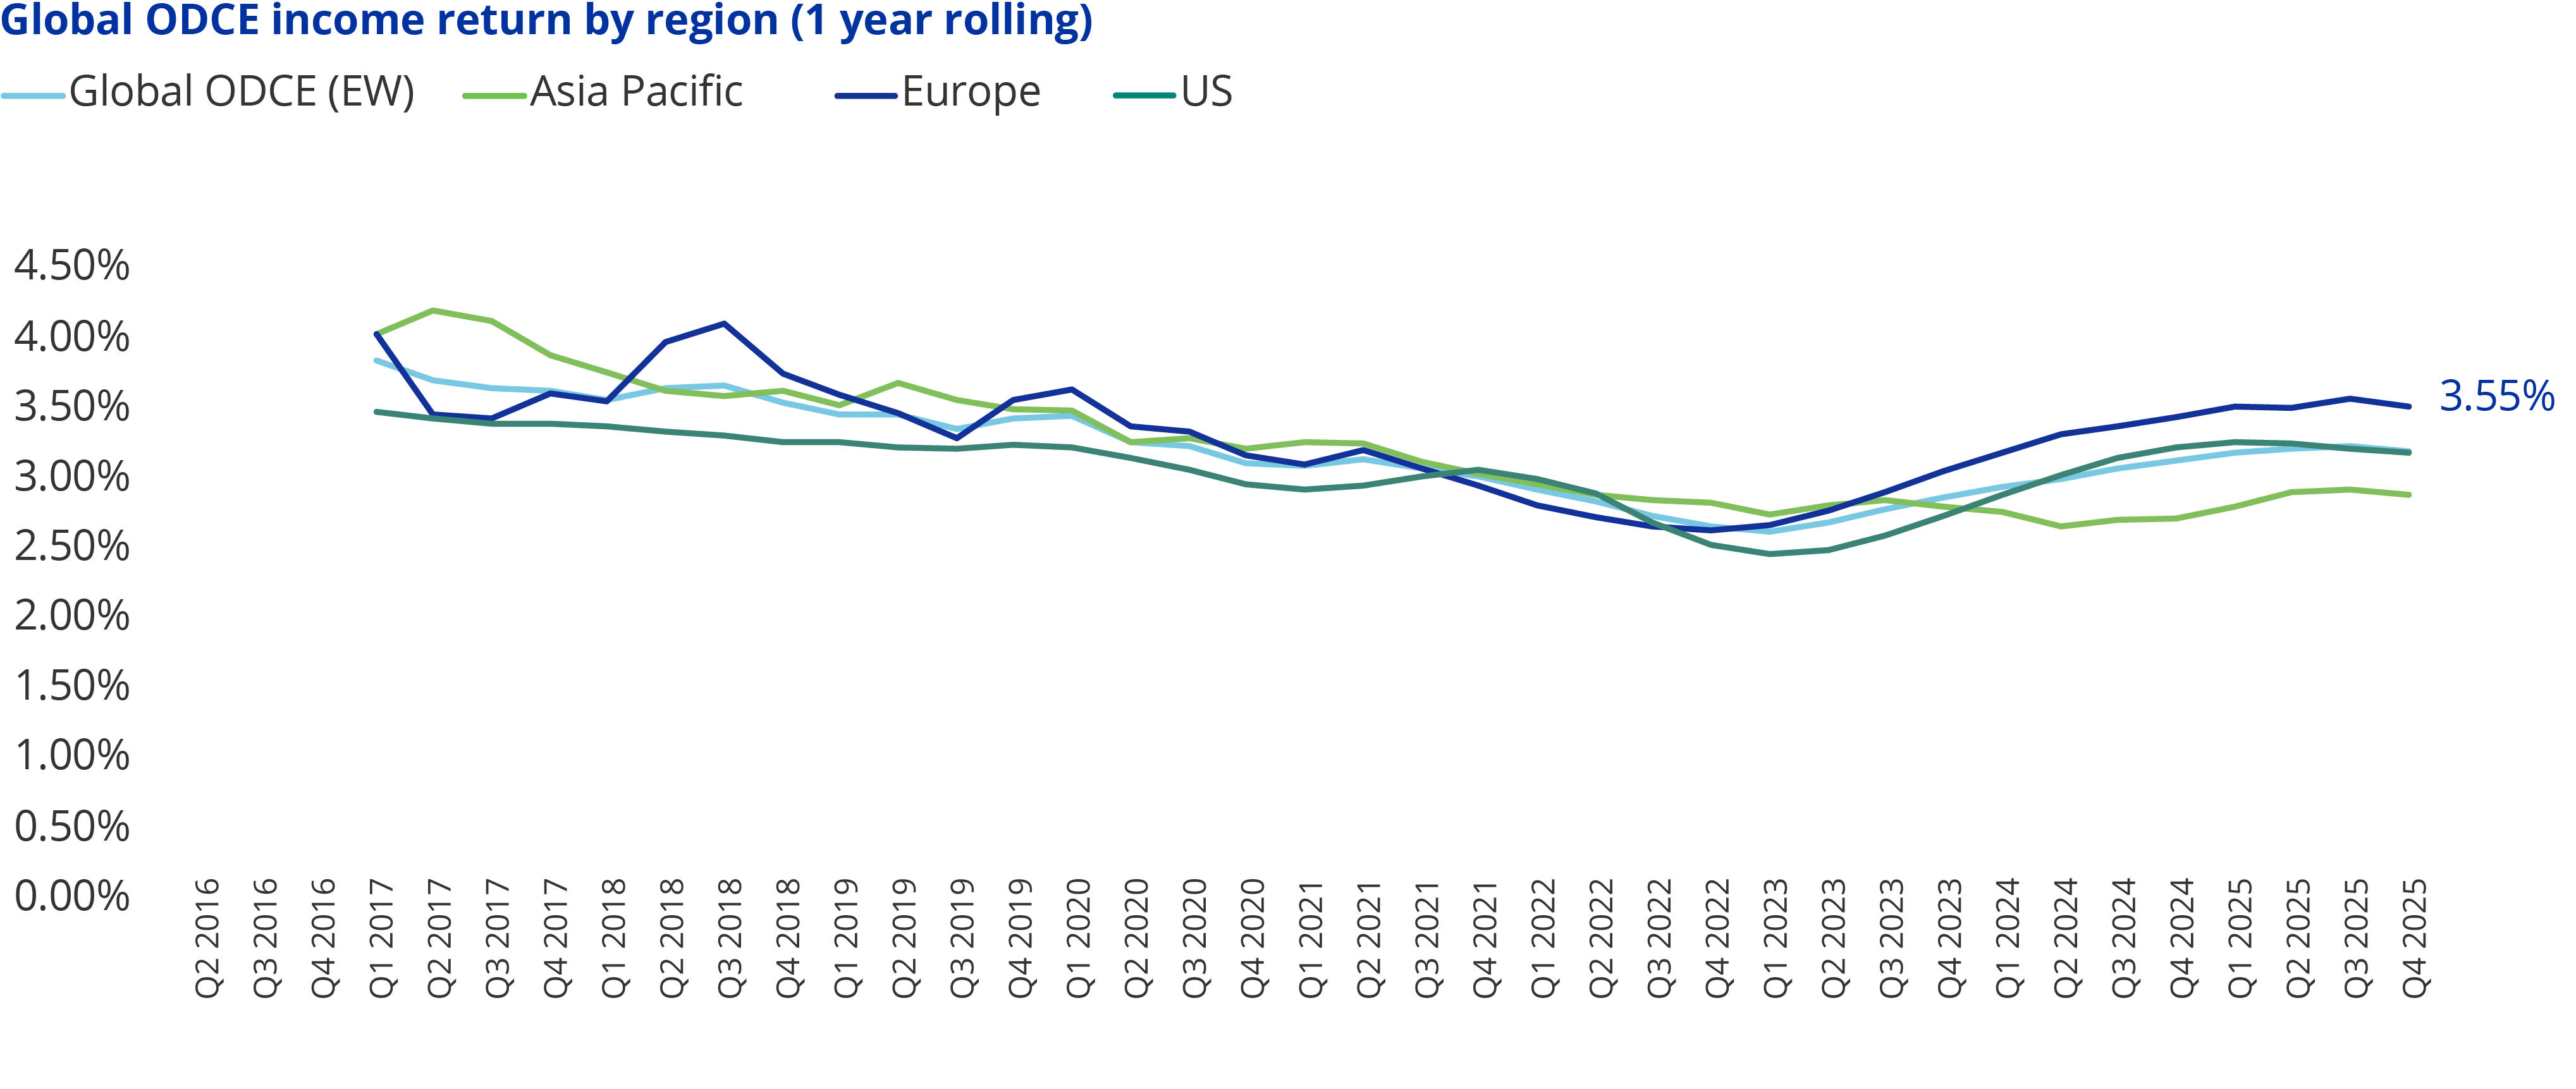
European ODCE funds’ income return outperforms other regions for ten consecutive quarters
The Global ODCE Index reported an annualised income return of 3.2% in 2025, 7 bps up from the 2024 equivalent. At 3.5%, the European funds showed the highest performance on a 12-month rolling basis, followed by the US funds and the Asia Pacific funds reporting 3.2% and 2.9%, respectively.
The European ODCE funds have now posted a higher income return than the other regions for ten consecutive quarters.
The report, Excel Supplement and snapshot for the Q4 2025 Global ODCE can be downloaded from the dedicated Global ODCE page.
Interested in more data-related resources? Check out our new Data theme page.