25 years of the INREV Quarterly Fund Index: shaping real estate investment strategies
The INREV Quarterly Fund Index has reached a major milestone – now covering 25 years of data, back to Q2 2000. This quarter-century of insights not only tracks performance but also shows how strategies and markets have evolved.
Evolution of fund styles and structures
Over the past 25 years, European non-listed funds have gone through significant change. Core has remained the dominant style throughout, while the weight of value added has varied over time. They were almost absent in the early 2000s, grew to around 15% of the market by 2009, then declined before making a comeback in the past five years — showing the cyclical nature of non-core strategies.
The structure of funds has also shifted, with a strong growth in open end funds. This reflects a change in investor preference for European non-listed real estate fund investments as highlighted by the ANREV/INREV/NCREIF Investment Intentions Survey. While many core funds are open ended, this was not always the case – some value added funds had open end structures in the 2000’s when those even represented over 10% of the number of funds within the index. Since 2010, open end core funds have significantly grown in size, both absolute and relative.
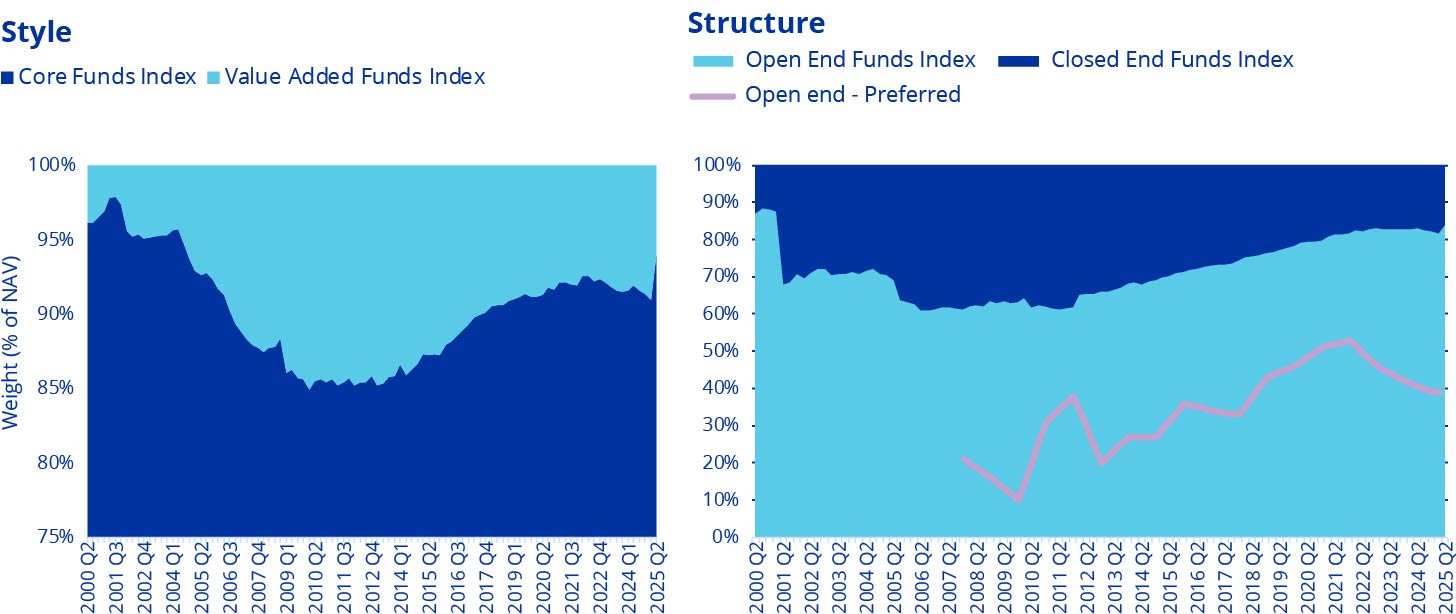
Source: INREV Data Platform and ANREV/INREV/NCREIF Investment Intentions Survey
From retail to industrial/logistics: changing fund strategies
Investment strategies have evolved, although some components remained the same. Single sector and multi sector funds in the index has been remarkably stable, with a 50/50 split across the 25 year history. But within single-sector strategy funds, focus has shifted dramatically. In the early years, retail and office dominated. Since 2020, industrial/logistics and residential funds have taken the lead.
Beyond traditional sectors, fund performance is available for alternative sectors including Health Care (11 funds: data from 2007), Hotel (5 funds: data from 2008), Parking (5 funds: data from 2010), and Student Housing (3 funds: data from 2017).
Geographic focus has also changed. Single-country funds have decreased over time, as multi-country funds grew larger. In June 2025, the average net asset value (NAV) was €720 million for both multi country and single country funds- a sharp contrast to 2005- when multi country funds was less than half the size of the single country funds’ average.
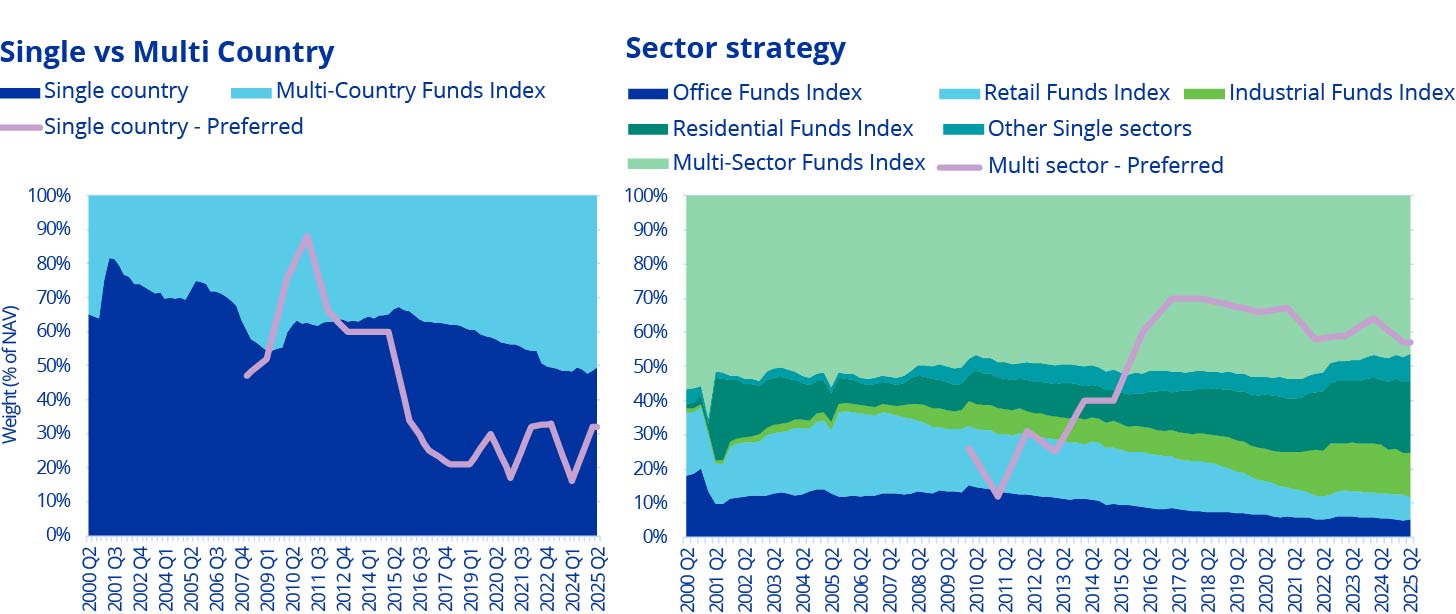
Source: INREV Data Platform and ANREV/INREV/NCREIF Investment Intentions Survey
Enhanced analytics via INREV tools
INREV’s interactive analysis tools allow users to slice and dice the data -creating custom indices and fund aggregations, by combining country and sector strategies. Currently, there are 22 standard subindices available in the index report alongside 22 additional combinations in the tool. The tool also allows users to apply additional filters such as fund structure, investment style, or fund size, as well as cross selection and cross index comparisons.
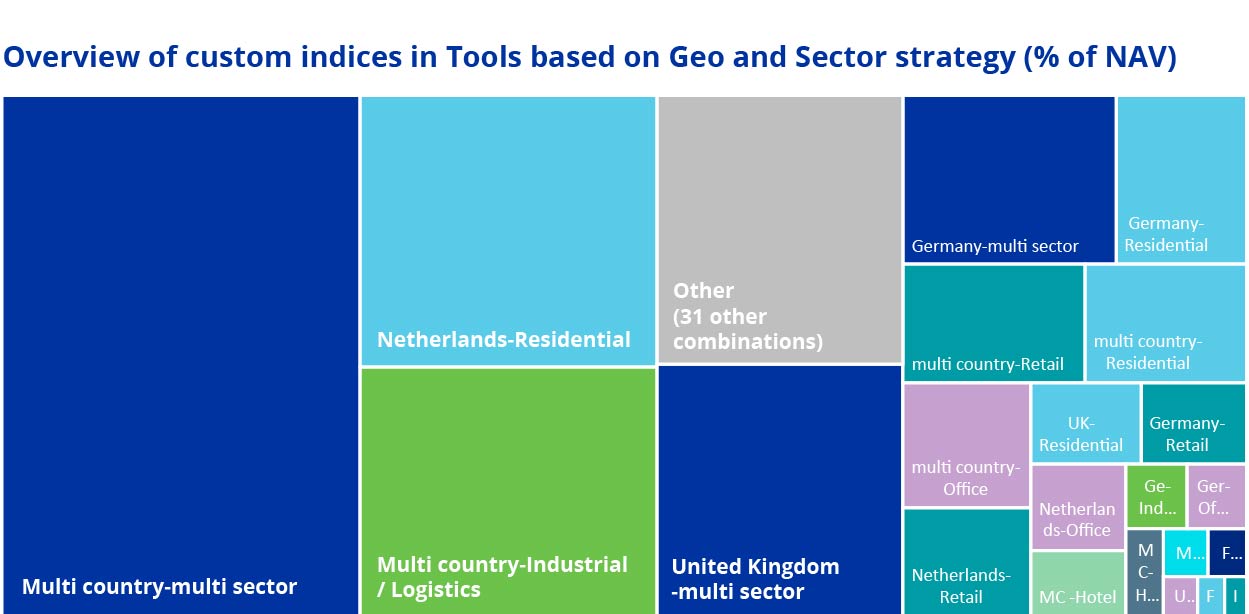
Source: INREV Data Platform
Enhanced analytics via INREV tools
INREV’s interactive analysis tools allow users to slice and dice the data -creating custom indices and fund aggregations, by combining country and sector strategies. Currently, there are 22 standard subindices available in the index report alongside 22 additional combinations in the tool. The tool also allows users to apply additional filters such as fund structure, investment style, or fund size, as well as cross selection and cross index comparisons.
If you would like to learn more about the INREV Fund index and Tools, please reach out to the INREV team, including Bert Teuben or Giulio Cappelloni.