Measuring Liquidity in Direct Real Estate Markets
At times of dislocation, whether that is the recent pandemic, the UK’s vote to leave the European Union or going back to the Global Financial Crisis (GFC), property market liquidity is of great concern to investors and managers. The direct real estate market is inherently illiquid when compared to equities or bonds; however, within that context of illiquidity, some property markets are undoubtedly more liquid than others.
Most of the ways used to measure real estate liquidity in the academic papers on the subject – time to trade, price movements while an asset is on the market, tracking the amount of tradeable stock – are almost impossible to calculate on a consistent basis across time and geography and are therefore largely unavailable to market participants. A simpler route is to look at transaction volumes as a proxy for liquidity, albeit it only provides a one-dimensional view.
To try and solve this problem and assist market participants in their decision-making the RCA liquidity scores combine data from 155 global real estate markets to provide a quantitative assessment of the depth and breadth of capital active in the market to create a probabilistic way of assessing investment liquidity.
Long-term analysis of the scores illustrates the intimate relationship between liquidity and pricing – buyers pay a premium for the most liquid markets, and an extra point on a market’s average liquidity score (out of 100) results in a five basis-point drop in average transaction yields. This confirms what most market participants know instinctively, but the ability to quantify this relationship is new.
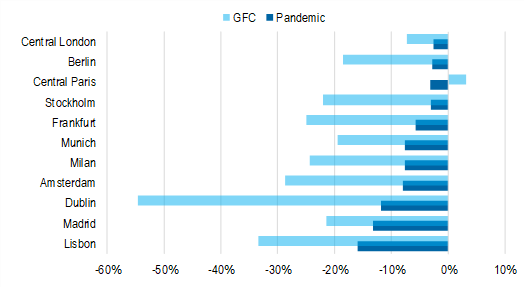
Those that were most liquid going into the pandemic retained liquidity better than those which were less liquid
The scores can also be used to measure how markets react during periods of uncertainty. Most recently, RCA was able to measure which markets held up best and which saw a sharp drop in liquidity during the pandemic. Those that were most liquid going into the pandemic retained liquidity better than those which were less liquid; i.e., investors shift preference towards structurally more liquid markets like London, Paris or the large German cities at times of uncertainty – a trend firmly confirmed over the years by the INREV Investment Intentions Survey.
Other markets such as Dublin, Madrid or Lisbon, which had seen a substantial increase in liquidity in the latter stage of the cycle, saw a sharper slowdown. A dependency on cross-border capital proved to be an Achilles heel during the lockdown periods, when international travel became difficult, if not impossible. Notably, these same markets showed greater volatility during the GFC as well.
Thinking about how market liquidity changes through the cycle, especially in these periods of dislocation, can assist with portfolio allocation strategies
However, it should be noted that the drop in investment liquidity due to the pandemic was, on average, much less severe than during the GFC. In Europe, the top 20 markets (ranked pre-pandemic) recorded an average drop of -7% for all property; whereas the same metric for the top 20 markets in the 12 months leading to the height of the GFC in September 2009 was -23%. In Berlin, market liquidity dropped by 3% in the pandemic and by 19% during the GFC; in Stockholm, it was -3% vs. -22%; and in Amsterdam it was -8% vs. -29%.
It should be noted that the drop in investment liquidity due to the pandemic was, on average, much less severe than during the GFC
This dynamic is reflected in the pricing metrics and the data show a much steeper decline in pricing during the GFC period than during the last 12-15 months. Indeed, RCA’s Commercial Property Price Indices based on a repeated sales, show prices actually increasing across many segments of the European real estate market. This might appear counterintuitive, but with the market polarised and demand focused on particular property types and locations, there is strong competition for the best quality assets, while those which are less desirable are not trading. This disconnect between aggregated demand and pricing was also observed between the liquidity scores and INREV Asset Level Index during the recent pandemic. A correlation analysis on the top 20 most liquid European cities showed little or no measurable relationship for the period Q1 2020 – Q1 2021, indicating an anomaly is present.
Thinking about how market liquidity changes through the cycle, especially in these periods of dislocation, can assist with portfolio allocation strategies. Investment managers can distinguish markets based on their average liquidity over time and stability of the investment market and use this framework to make more informed decisions: if you can measure liquidity risk then you can better manage it.
this article was written by Tom Leahy, Senior Director of Analytics for the EMEA region at Real Capital Analytics and Member of the INREV Research Committee since 2021