5 INREV Data Platform features you should know about
Beyond the asset- and fund-level indices, the INREV membership includes access to analysis tools to create custom indices and for research purposes. The tools have been developed based on member input and feedback in the last couple of years and offer unique insights.
Access to the tools only requires you to define your role on the INREV Data Platform (data providers vs. viewer). Since August last year, we have seen a sharp increase in the platform by almost 400 users, totalling to 1600 registered users. To highlight functions that not all data platform users might know about, the INREV team would like to share some of the features they use frequently and are available for members to utilise.
Save customised indices to match mandate and strategies
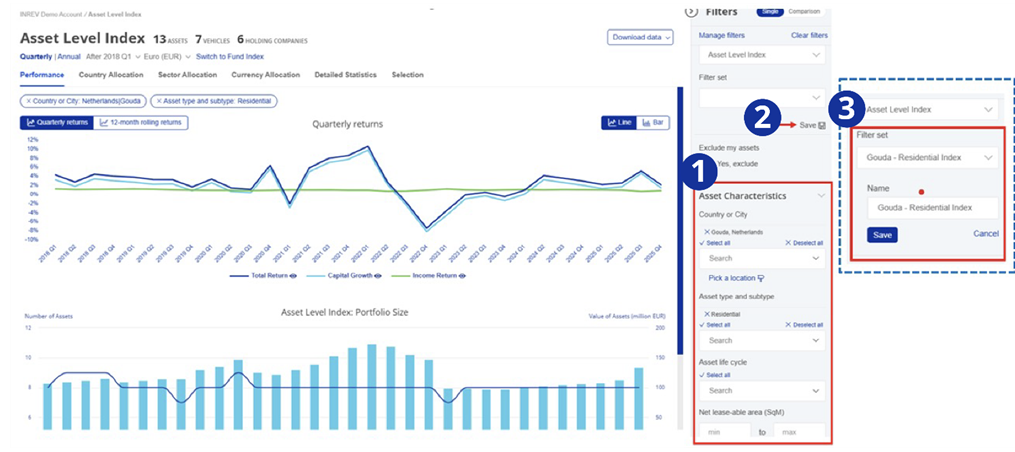
Connor van Leeuwen, Market Information Manager at INREV, often relies on the analytical tools in the INREV Data Platform to create custom and bespoke indices by applying filters for performance insights and market comparison. Filters could match an investor’s mandate or the strategy of an individual fund. The tools offer an option to save the selection to easily return to it for later use.
To save a customised index, you would need to:
- Create a customised index through the filter options in the right-hand side menu
- Once all filters have been applied, click on ‘Save’
- Name your customised index to select it easily from the filter set list at any time
Pick a Location to analyse local market dynamics
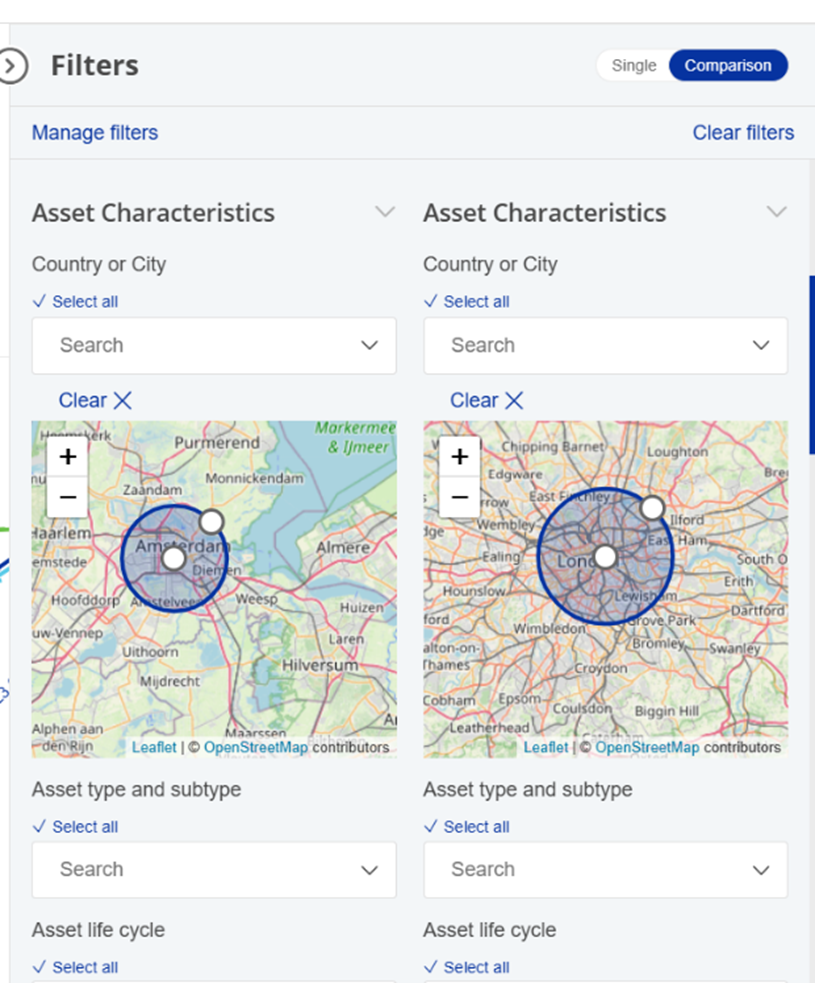
One of the Asset Level Index’s useful features is the “Pick a location” tool. Jeanne Besner, Market Information Associate, highlights that by using this spatial flexibility, the “Pick a location” tool enables a more granular and customised analysis of asset performance. Available in the filter menu, this option allows users to view performance data for a specific location and its surrounding radius.
For example, users can easily isolate residential assets within different parts of the same city or compare industrial parks of two different cities. This level of geographic precision makes it easier to analyse local market dynamics and uncover more targeted insights. The feature can also be used in comparison mode, allowing users to compare their own assets against the Index within a defined geographic area.
Create custom aggregation for organisation level reporting
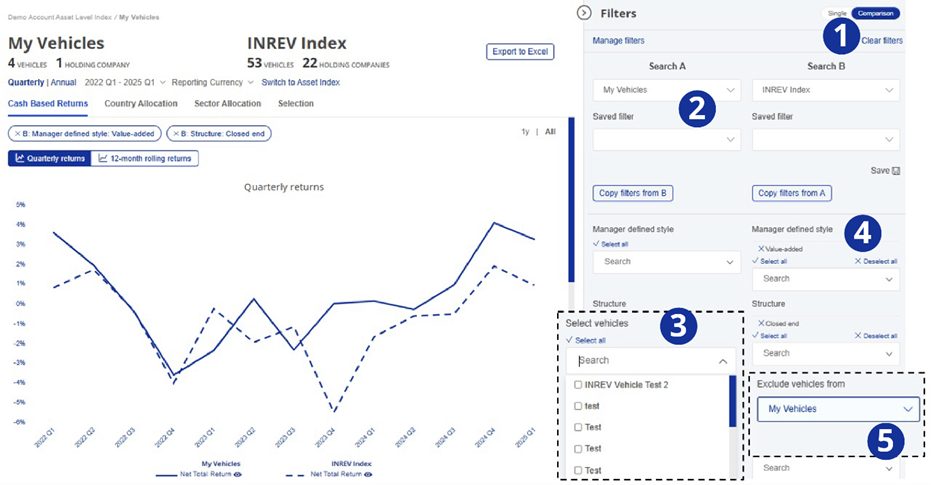
For the comparison at the organisational level, performance can be aggregated for all vehicles or a selection of vehicles at both the asset and fund level. Bert Teuben, Senior Manager Market Information, shares how the tools allow for comparing the aggregate with a custom index, which mirrors the characteristics of the vehicles that are aggregated, like closed end funds. This allows us to understand the relative returns both in the short-term and for longer time horizons.
For creating such an analysis, you would need to:
- Select the comparison function
- Define my vehicles and an index
- Select vehicles you would like to compare
After that, filters could be applied to match the strategy of the selected vehicles. In case of a large weight in the index, the vehicles managed could be excluded from the index to get an index excluding your own performance.
Allocation insights across indices and portfolios
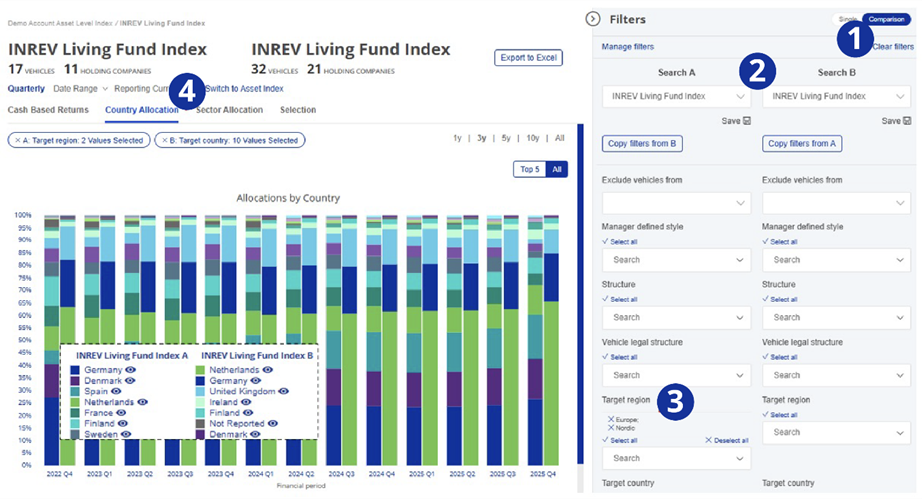
For Giulio Cappelloni, Market Information Associate at INREV, the Fund Index analysis tool not only allows him to compare portfolio performance with bespoke indices, but also enables the analysis of country and sector allocations across two time series, such as a portfolio versus a comparable index or between two sub indices. This provides a clear view of relative composition, helping to identify key drivers of performance, as well as potential concentration risks, diversification benefits, and relative positioning and to compare results against a reference portfolio.
For example, the Living Fund Index performance can be broken down into multi country and single country vehicles, offering insight into how different geographical strategies contribute to results. This analysis is made possible by:
- The comparison functionality on the data platform
- The indices available in the search boxes
- The wide range of filters
- The country allocation view, which enables exposure comparisons between two time series since inception
Quartile analyses show the dispersion and consistency of performance
Beyond the visuals in the tools themselves, Excel exports of the tools provide additional insights. One of the additional insights that Sam van Elburg, Real Estate Data Analyst, highlights is quartile information on the income return, capital growth and total returns. These insights provide insights into the dispersion of fund returns and could be seen as an indication of risk in the market. Another use case is to see the spread of returns and the position of the individual fund performance compared to similar funds in a (custom) index.
With all of these helpful features, the Market Information team hopes to encourage members to explore the full potential of the INREV Data Platform. Whether creating customised indices, analysing local market dynamics or comparing portfolio allocations, the tools offer a flexible and robust way to gain deeper insight into the non‑listed real estate market. Check out the INREV Data Platform now to try these tools yourself.